In the digital age, understanding user behavior is pivotal for achieving online success. One of the most effective ways to gain insights into how visitors interact with your website is through heatmaps. These powerful visual tools provide a snapshot of user interactions, enabling you to refine your website and enhance user experience. In this article, we’ll delve into what heatmaps are, how they work, and the invaluable insights they can uncover.
What Are Heatmaps?
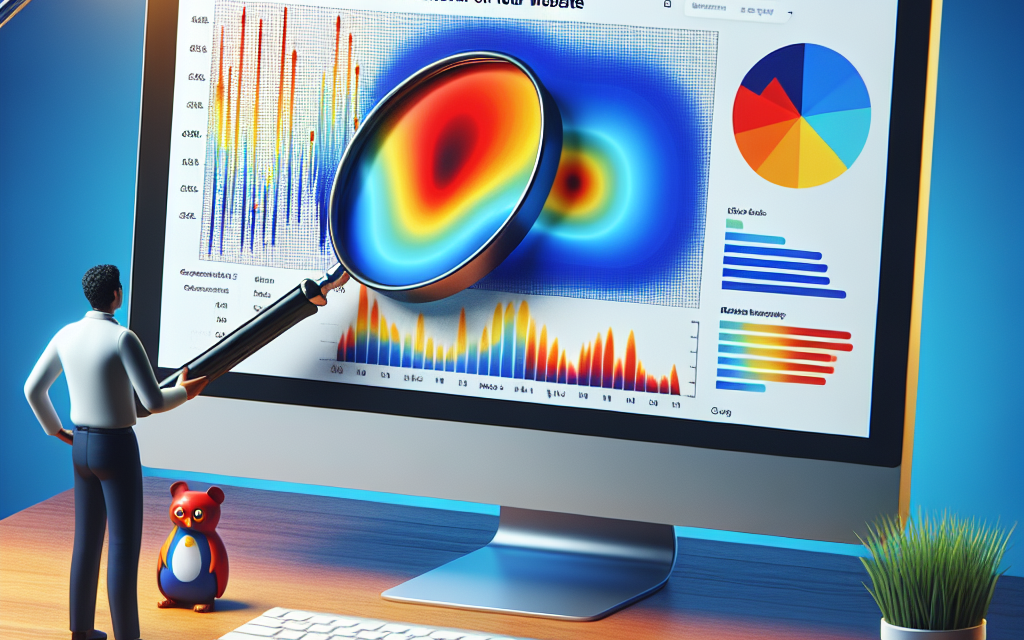
Heatmaps are graphical representations of data that display values in two dimensions using colors. When applied to your website, they reveal where users click, scroll, and hover most. This visual representation allows website owners to quickly identify which areas attract attention and which are overlooked.
Types of Heatmaps
-
Click Heatmaps: These show where visitors click on your pages, highlighting the most popular areas.
-
Scroll Heatmaps: These illustrate how far down the page users scroll, helping you understand which content keeps their interest.
- Move Heatmaps: These track mouse movements and indicate how users navigate your page, providing insight into their behavior before making a click.
Why Use Heatmaps?
Understanding user behavior through heatmaps can provide several advantages:
1. Optimize User Experience
By identifying the areas where users interact most, you can enhance the layout and design of your pages. For instance, if users frequently click on an image thinking it’s a link, consider making it a clickable element to enhance user experience.
2. Improve Conversion Rates
Heatmaps can help identify bottlenecks in your conversion funnel. If users are dropping off at a specific point, you can investigate and modify that section to boost conversions. For example, simplifying forms or repositioning call-to-action buttons can increase engagement.
3. Content Effectiveness
Determine which content resonates with your audience by analyzing scroll patterns. If users are not scrolling past a certain point, it might indicate that they’re losing interest or that the content isn’t engaging enough.
4. A/B Testing Insights
By understanding user behavior, you can make informed decisions in your A/B tests. Heatmaps provide empirical data that can help justify design changes and the effectiveness of different approaches.
Tools for Implementing Heatmaps
There are numerous tools available for generating heatmaps on your WordPress site. Some popular ones include:
- Hotjar: An all-in-one tool for heatmaps, visitor recordings, and feedback polls.
- Crazy Egg: Offers heatmaps and A/B testing features for optimizing your site.
- Mouseflow: Provides heatmaps along with session replay and funnels for analysis.
Integrating these tools into your WordPress site is straightforward. Many of them offer easy-to-install plugins, making it seamless to begin tracking user interactions.
Getting Started with Heatmaps
- Choose a Heatmap Tool: Select one that fits your needs and budget.
- Install the Plugin: If your chosen tool offers a WordPress plugin, install it directly from the WordPress Plugin Directory.
- Monitor User Behavior: Start collecting data and monitoring how users interact with your site.
- Analyze Results: Look for patterns in the heatmaps, and decide on actionable changes you can implement.
- Make Adjustments: Optimize your website based on the insights gathered.
Conclusion
Heatmaps are a powerful weapon in your arsenal for understanding user behavior and improving website performance. By leveraging these tools, you can uncover valuable insights to drive your website’s success and enhance user experience.
Call to Action: Experience NextGen WordPress with WafaTech!
Ready to take your WordPress site to the next level? Discover WafaTech’s NextGen WordPress hosting solutions designed to optimize performance and enhance user experiences. With our expert support and advanced features, your website will not only attract visitors but also keep them engaged! For more details, visit WafaTech WordPress Hosting today!


