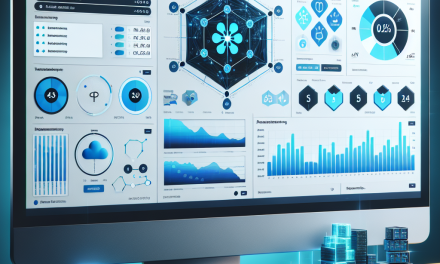
In the rapidly evolving landscape of cloud-native applications, managing and monitoring distributed systems has become paramount. Kubernetes, as the leading container orchestration platform, provides essential tools for deploying, scaling, and managing applications. However, achieving deep observability within Kubernetes environments is a challenge that many developers and DevOps teams face. Enter OpenTelemetry — an open-source observability framework that can significantly enhance the visibility and performance of applications running on Kubernetes.
Understanding Observability
Observability refers to the ability to measure and understand the internal state of a system based on the data it produces. It encompasses three pillars: metrics, logs, and traces. Each of these components offers unique insights into how applications behave and allows teams to identify issues, optimize performance, and enhance user experiences.
- Metrics provide quantitative data about the health and performance of applications.
- Logs capture real-time data about events occurring within an application, offering a narrative of execution.
- Traces provide a timeline of requests as they flow through services, highlighting the interactions between components.
To effectively achieve observability, teams need to integrate these data points in a coherent manner, which is where OpenTelemetry shines.
What is OpenTelemetry?
OpenTelemetry is a robust and vendor-agnostic observability framework. It provides APIs, libraries, agents, and instrumentation to enable developers to collect telemetry data (i.e., metrics, logs, and traces) from their applications and infrastructure.
Designed to work seamlessly with various backends, OpenTelemetry empowers developers to instrument their applications with minimal effort. This flexibility is further enhanced by its compatibility with Kubernetes, allowing teams to monitor complex microservices architectures effectively.
Benefits of Using OpenTelemetry in Kubernetes
-
Unified Data Collection: OpenTelemetry allows developers to collect metrics, logs, and traces from a single framework, eliminating silos and enabling a comprehensive view of applications. This integration simplifies observability and reduces the complexity of having multiple tools for different data types.
-
Vendor-Agnostic: With OpenTelemetry, organizations are not locked into a specific vendor. They can switch backends or even use multiple solutions without altering the instrumentation code. This portability is a game-changer for teams looking to optimize their observability strategy.
-
Rich Ecosystem Support: OpenTelemetry supports a myriad of programming languages and frameworks, making it easy to instrument a diverse set of applications. Libraries for Java, Python, JavaScript, Go, and many others are available, ensuring wide applicability across development teams.
-
Seamless Integration with Kubernetes: OpenTelemetry works hand-in-hand with Kubernetes’ ecosystem. Whether using Helm charts to install observability agents or leveraging sidecar containers for telemetry data collection, teams can deploy OpenTelemetry solutions quickly and efficiently.
- Enhanced Troubleshooting and Debugging: Tracing capabilities in OpenTelemetry enable teams to visualize the call path of requests through different services. This visibility aids in quickly identifying bottlenecks, latencies, and error sources, drastically reducing mean time to resolution (MTTR).
Getting Started with OpenTelemetry on Kubernetes
To illustrate the implementation of OpenTelemetry for Kubernetes, consider the following high-level steps:
Step 1: Install OpenTelemetry Collector
The OpenTelemetry Collector is a component that receives, processes, and exports telemetry data. You can deploy it as a standalone service or as a sidecar container within your application pods. Using Helm, you can install the collector with the following command:
helm repo add open-telemetry https://open-telemetry.github.io/opentelemetry-helm-charts

helm install my-otel-collector open-telemetry/opentelemetry-collector
Step 2: Instrumenting Your Application
Next, you’ll need to instrument your application using OpenTelemetry’s SDKs. For example, in a Python application, you can use the opentelemetry-api and opentelemetry-instrumentation packages:
from opentelemetry import trace

from opentelemetry.instrumentation.flask import FlaskInstrumentor


app = Flask(__name__)

FlaskInstrumentor().instrument_app(app)


# Example route

@app.route('/')

def hello():

    return 'Hello, OpenTelemetry!'
Step 3: Configure Exporters
After instrumentation, configure exporters to define where your telemetry data should be sent (e.g., to a logging service or monitoring platform). OpenTelemetry supports several popular backends, such as Prometheus, Jaeger, and Zipkin. Set the exporter in the OpenTelemetry Collector’s configuration file.
Step 4: Monitor and Analyze
Once everything is set up, you can start monitoring your application telemetry data. Utilize your chosen backend’s UI to visualize metrics, logs, and traces, enabling deeper insights into application performance and behavior.
Conclusion
As Kubernetes continues to gain traction, so does the need for enhanced observability within its ecosystems. OpenTelemetry provides a powerful, unified framework that simplifies the collection and analysis of telemetry data, allowing teams to gain valuable insights into their applications.
By integrating OpenTelemetry with Kubernetes, organizations can effectively navigate the complexities of cloud-native environments, leading to improved application performance, rapid troubleshooting, and ultimately a better experience for users.
Incorporating this observability framework into your Kubernetes applications is not just a trend; it’s a necessity for anyone serious about delivering high-quality, reliable software in today’s fast-paced digital world.
By embracing Kubernetes and OpenTelemetry together, your team can ensure that your applications are not just running but thriving, backed by the insights necessary to innovate and optimize continuously.


